Note
This guide applies to Steeltoe v3. This component has been removed from v4.
Using Wavefront for app container metrics, distributed tracing, and observability
This tutorial takes you creating a simple Steeltoe app with actuators, logging, and distributed tracing. With that app running you then export the data to a Wavefront account.
Note
For more detailed examples, please refer to the Management solution in the Steeltoe Samples Repository.
Prereq's
You'll need a Wavefront account to complete this guide successfully. Create a 30 day trial, if you don't already have access.
First, clone to accompanying repo that contains all the needed assets
-
git clone https://github.com/steeltoeoss-incubator/observability.gitcd observability/wavefront Have a look at what things are provided
lsName Description ---- ---- dashboard-template.json Wavefront dashboard configuration docker-compose.yml Docker file to start all containers telegraf.conf Telegraf inputs and output configurationReplace the placeholder
YOUR_API_TOKENin docker-compose.yml with your Wavefront API token. Lean how to retrieve that token here.
Then create a .NET Core WebAPI with the correct Steeltoe dependencies
Create a new ASP.NET Core WebAPI app with the Steeltoe Initializr
Name the project "WavefrontObservability"
Add the "Actuators" dependency
Add the "Dynamic Logger" dependency
Add the "Docker" dependency
Click Generate to download a zip containing the new project
Extract the zipped project and open in your IDE of choice
Add the other needed actuators in startup.cs
using Steeltoe.Management.Endpoint.Metrics;
using Steeltoe.Management.Tracing;
using Steeltoe.Management.Exporter.Tracing;

public class Startup {
  public void ConfigureServices(IServiceCollection services) {
      services.AddPrometheusActuator(Configuration);
      services.AddMetricsActuator(Configuration);
      services.AddDistributedTracing(Configuration);
      services.AddZipkinExporter(Configuration);
  }

  public void Configure(IApplicationBuilder app, IWebHostEnvironment env) {
    app.UsePrometheusActuator();
    app.UseMetricsActuator();
      app.UseTracingExporter();
  }
}
Set the actuator path, exposure, and zipkin server address in appsettings.json
{
  "Logging": {
    "LogLevel": {
      "Default": "Debug",
      "System": "Information",
      "Microsoft": "Information"
    }
  },
  "spring": {
    "application": {
      "name": "Wavefront_demo_app"
    }
  },
  "management": {
    "endpoints": {
      "actuator": {
        "exposure": {
          "include": ["*"]
        }
      },
      "path": "/",
      "cloudfoundry": {
        "validateCertificates": false
      }
    },
    "metrics": {
      "exporter": {
        "cloudfoundry": {
          "validateCertificates": false
        }
      }
    },
    "tracing": {
      "alwaysSample": true,
      "useShortTraceIds ": true,
      "exporter": {
        "zipkin": {
          "endpoint": "http://wavefront-proxy:9411/api/v2/spans",
          "validateCertificates": false
        }
      }
    }
  }
}
Adjust docker-compose.yml to include the path to the .NET project by replacing
<ABSOLUTE_PATH_TO_PROJECT>with the absolute path to the folder holding the .csproj file.
Next, deploy everything with docker compose
Build the image using the provided docker-compose file
docker-compose up -dConfirm everything started successfully by running
docker-compose psand checking the State. Output should look similar to this:Name Command State Ports ----------------------------------------------------------------------------------------------------------------------------- steeltoe-app dotnet Grafana_Observabili ... Up 0.0.0.0:80->80/tcp telegraf /entrypoint.sh --config=/e ... Up 8092/udp, 8094/tcp, 8125/udp wavefront-proxy /bin/bash /run.sh Up 0.0.0.0:2878->2878/tcp, 3878/tcp, 4242/tcp, 0.0.0.0:9411->9411/tcp
Finally use Wavefront to view the metrics and traces being fed in
Navigate to your Wavefront instance and the "Dashboards" area
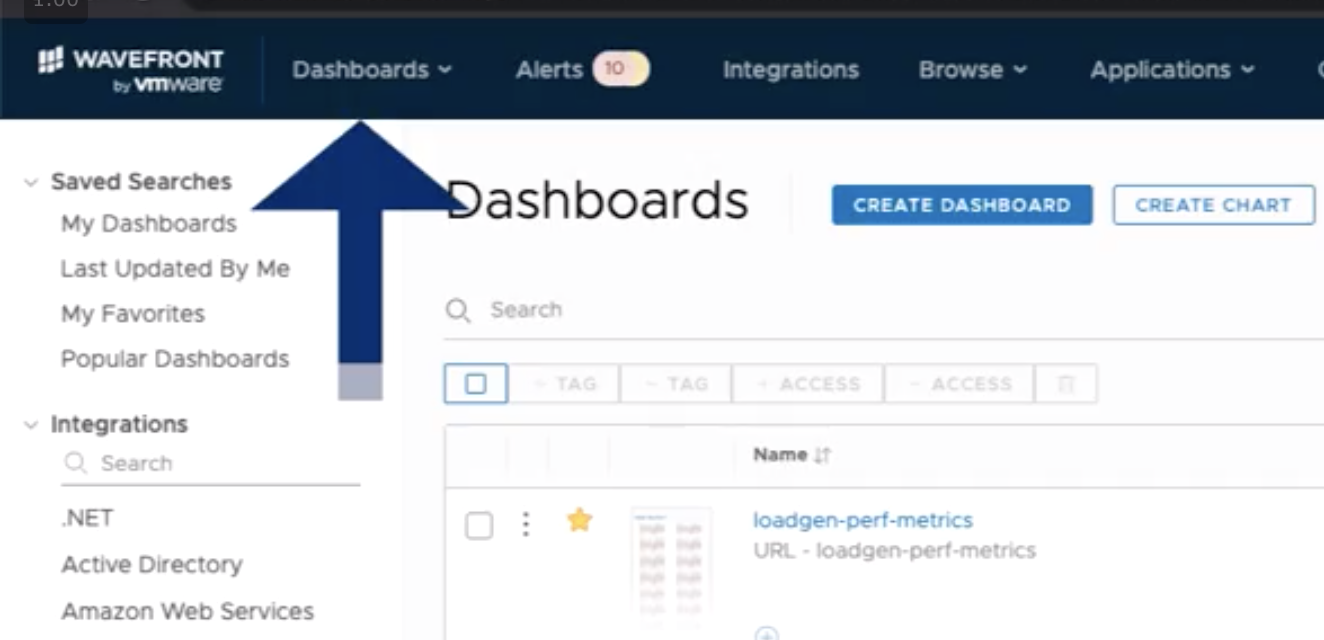
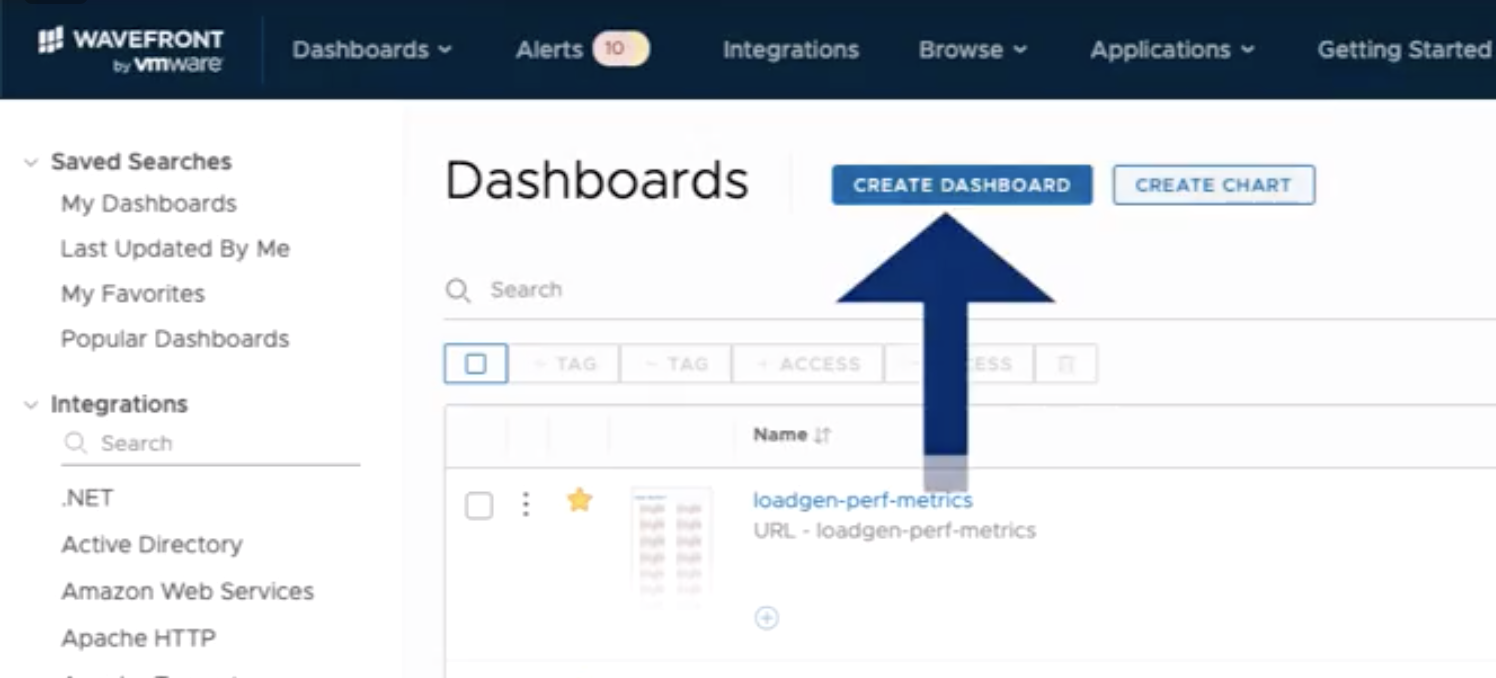
Create a new dashboard by clicking "Create Dashboard" button
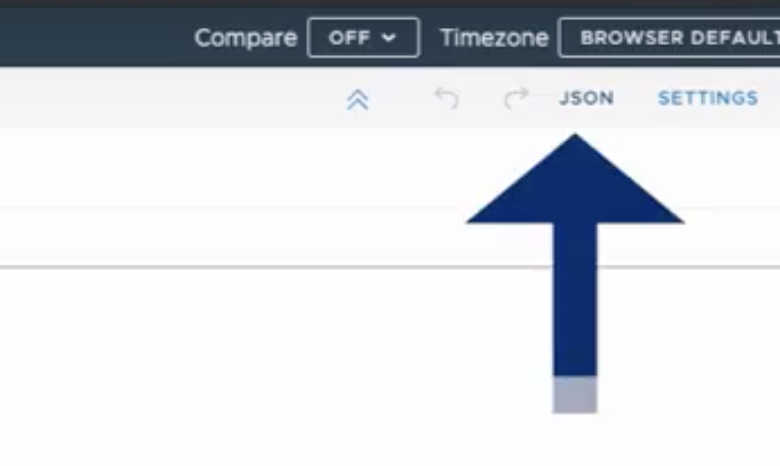
Now locate the "JSON" link toward the top of the window and click
A popup window will be shown. Find the "Tree" drop down in the blue bar and change to "Code" view.
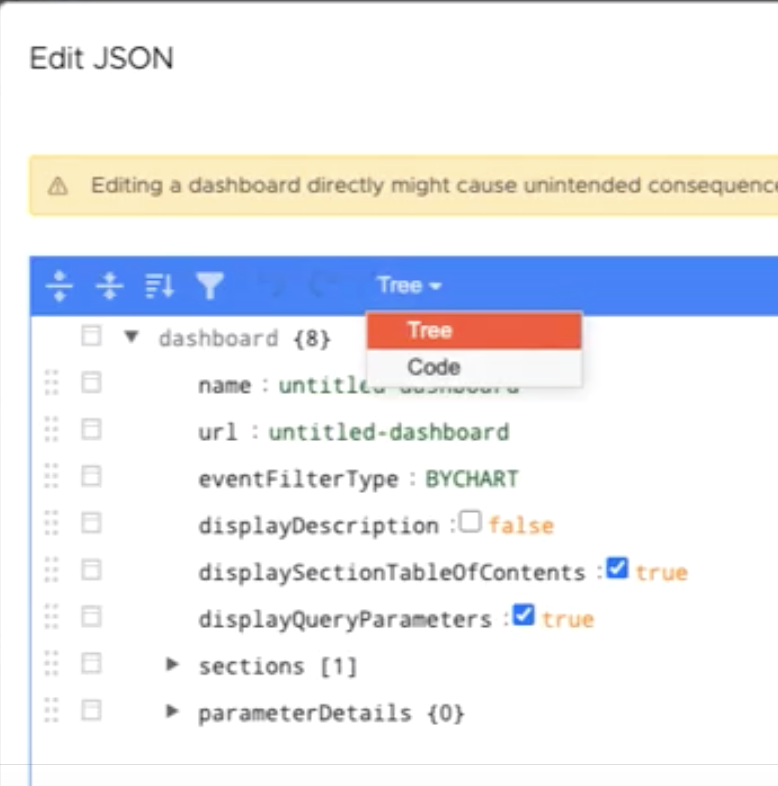
Clear the pre-loaded JSON in the window and copy the contents of dashboard-template.json to the window.
Click the "Accept" link to close the window and let Wavefront parse the JSON.
Save your new dashboard by clicking the "Save" link at the top. A popup window will ask you to name your new dashboard and finish saving.
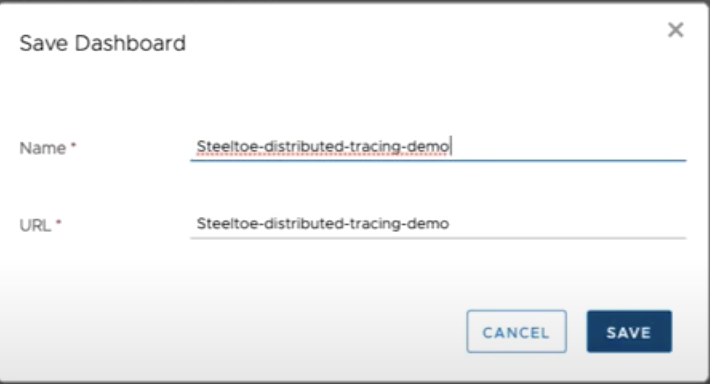
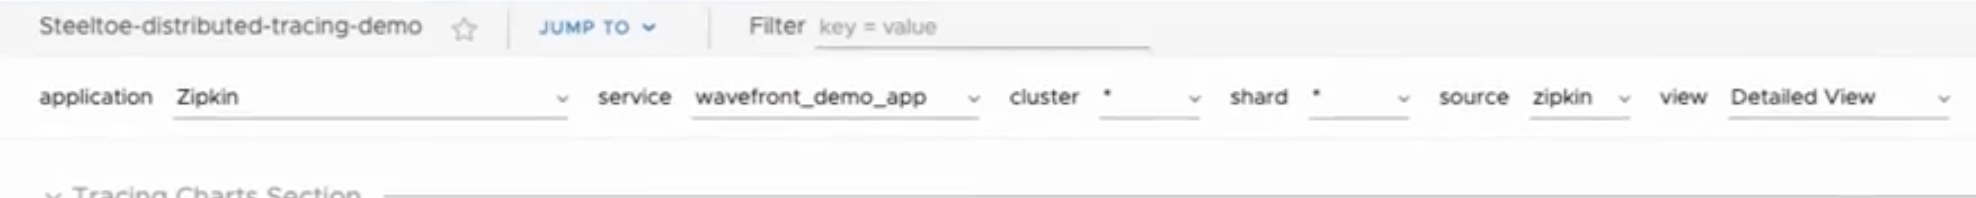
> [!NOTE]
> You must save the new dashboard for your application name to show and things start receiving data.
To make sure the correct traces are being used, in the top bar make sure the "application" is set to "Zipkin" and the "service" is set to the name of your application.
Done! Everything else should be pre-loaded for you. As the application runs in Docker, the metrics are shown.
Further learning in Wavefront
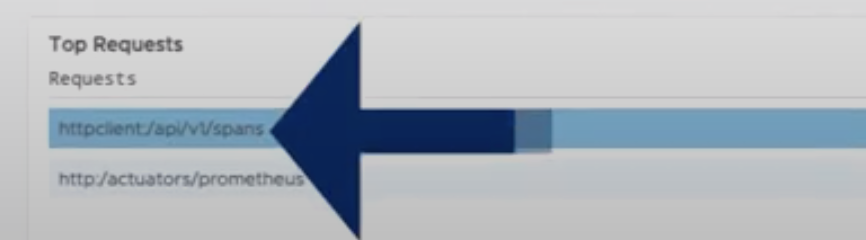
Notice the chart "Top Requests" in the bottom left corner. Click one of the URLs to view all of the traces coming in for your Steeltoe application. If you had other microservices they would also appear here and you can even configure your traces to deliver logs as well.
You can see your traces on the left and sort them, on the right you will see other metrics as well.
To get even deeper, select a trace in the left and then find the "traceid" in the "Critical Path Breakdown" area. Copy that value.
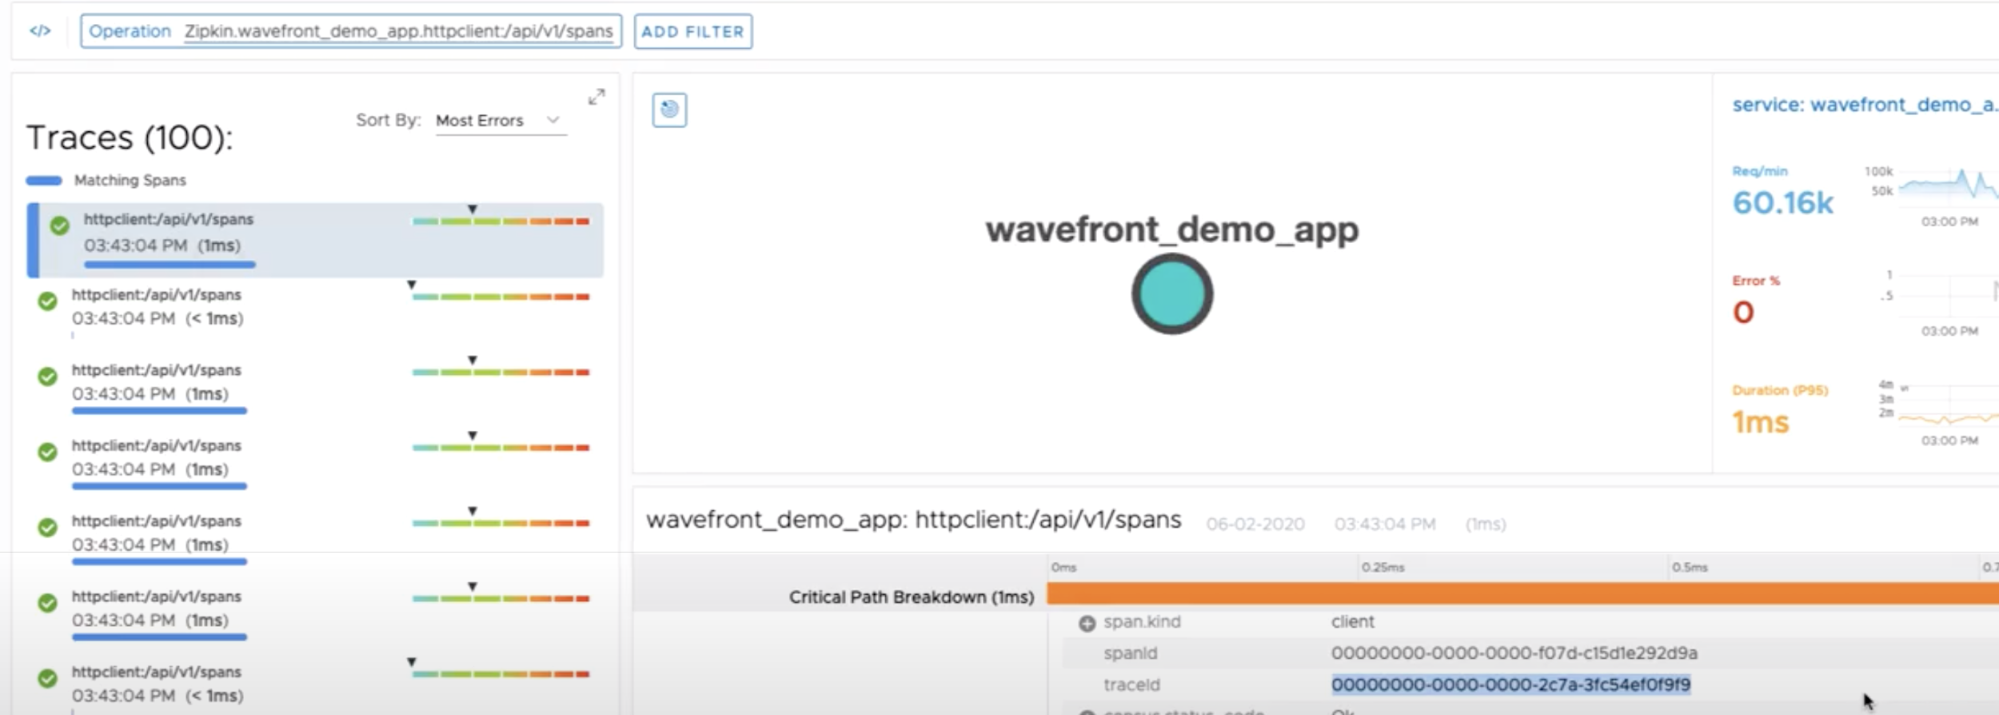
Then "Add Filter" from the link at the top and paste that traceid value in the "TraceId" text box. Now click the "Add Trace Id" button. Your view will refresh to show all the essentials of that specific trace!

Creating filters gives you all kinds of different ways to view data. In the "Add Filter" window clear the traceid value and click the "</>" button. This switches your filter view to thre query builder. Here are a few queries to get started:
Get the last 100 traces:
limit(100, traces("Zipkin.wavefront_demo_app.httpclient:/api/v1/spans"))Find traces that took longer than 30 seconds:limit(100, highpass(30ms, traces("Zipkin.wavefront_demo_app.httpclient:/api/v1/spans")))
If you would like to learn more about the query builder have a look at Wavefront docs.