Note
This guide applies to Steeltoe v3. Please open an issue if you'd like to help update the content for Steeltoe v4.
Using Tanzu App Manager for app container metrics, distributed tracing, and observability
This tutorial takes you creating a simple Steeltoe app with actuators, logging, and distributed tracing. With that app running you then export the data to a Tanzu Application Services foundation.
Note
For more detailed examples, please refer to the Management solution in the Steeltoe Samples Repository.
Prereq's
You'll need access to Tanzu Application Services to complete this guide.
First, start a Zipkin instance.
Start an instance of Zipkin, named myappmanagerservice
cf push myappmanagerservice --docker-image steeltoeoss/zipkinOnce the app is deployed and the Zipkin server is started, the cf cli will print out the public route. An example route would be
mytracingexample.cfapps.io. You will need this value below.
Next, create a .NET Core WebAPI with the correct Steeltoe dependencies.
Create a new ASP.NET Core WebAPI app with the Steeltoe Initializr
Name the project "TASObservability"
Add the "Actuators" dependency
Click Generate to download a zip containing the new project
Extract the zipped project and open in your IDE of choice
Add the other needed actuators in startup.cs
using Steeltoe.Management.Endpoint.Metrics;
using Steeltoe.Management.Tracing;
using Steeltoe.Management.Exporter.Tracing;

public class Startup {
  public Startup(IConfiguration configuration) {
     Configuration = configuration;
  }

  public IConfiguration Configuration { get; }

  public void ConfigureServices(IServiceCollection services) {
    services.AddPrometheusActuator(Configuration);
    services.AddMetricsActuator(Configuration);
    services.AddDistributedTracing(Configuration);
    services.AddZipkinExporter(Configuration);
    services.AddControllers();
  }

  public void Configure(IApplicationBuilder app, IWebHostEnvironment env) {
    if (env.IsDevelopment()) {
       app.UseDeveloperExceptionPage();
    }
    app.UsePrometheusActuator();
    app.UseMetricsActuator();
    app.UseTracingExporter();
    app.UseRouting();
    app.UseEndpoints(endpoints =>
    {
       endpoints.MapControllers();
    });
  }
}
Set the actuator path, exposure, and zipkin server address in appsettings.json
{
  "Logging": {
    "LogLevel": {
      "Default": "Debug",
      "System": "Information",
      "Microsoft": "Information"
    }
  },
  "spring": {
    "application": {
      "name": "TASObservability"
    }
  },
  "management": {
    "endpoints": {
      "actuator": {
        "exposure": {
          "include": ["*"]
        }
      },
      "path": "/",
      "cloudfoundry": {
        "validateCertificates": false
      }
    },
    "metrics": {
      "exporter": {
        "cloudfoundry": {
          "validateCertificates": false
        }
      }
    },
    "tracing": {
      "alwaysSample": true,
      "useShortTraceIds ": true,
      "exporter": {
        "zipkin": {
          "endpoint": "http://<ZIPKIN_SERVER_ROUTE>/api/v2/spans",
          "validateCertificates": false
        }
      }
    }
  }
}
Run the application
Add the Cloud Foundry configuration provider in Program.cs
using Steeltoe.Extensions.Configuration.CloudFoundry;
...
var builder = WebHost.CreateDefaultBuilder(args)
  ...

  .AddCloudFoundry()
  .UseStartup<Startup>();
Publish the application locally using the .NET cli. The following command will create a publish folder automatically.
dotnet publish -o .\publish <PATH_TO>\TASObservability.csprojCreate manifest.yml in the same folder as TASObservability.csproj
---
applications:
  - name: TASObservability
    buildpacks:
      - dotnet_core_buildpack    stack: cflinuxfs3
Tip
With yaml files indention and line endings matter. Use an IDE like VS Code to confirm spacing and that line endings are set to
LF(not the Windows defaultCR LF)Push the app to Cloud Foundry
cf push -f <PATH_TO>\manifest.yml -p .\publishNavigate to the application endpoint
https://<APP_ROUTE>/api/valuesWith the application successfully pushed, navigate to App Manager to see the new features enabled.

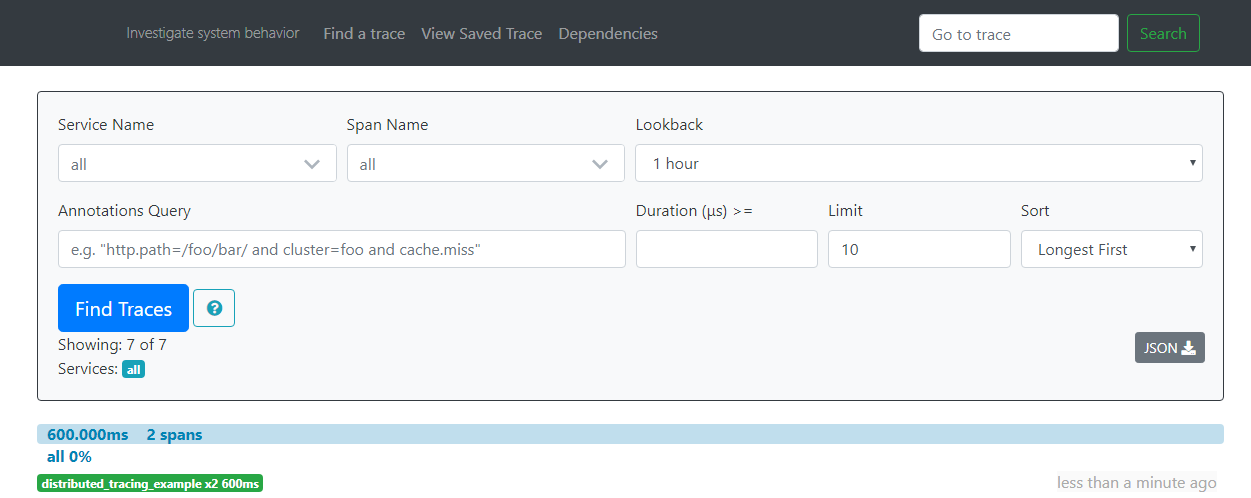
Now that you have successfully run a request through the app, navigate back to the zipkin dashboard and click the "Find Traces" button. This will search for recent traces. The result should show the trace for your request.
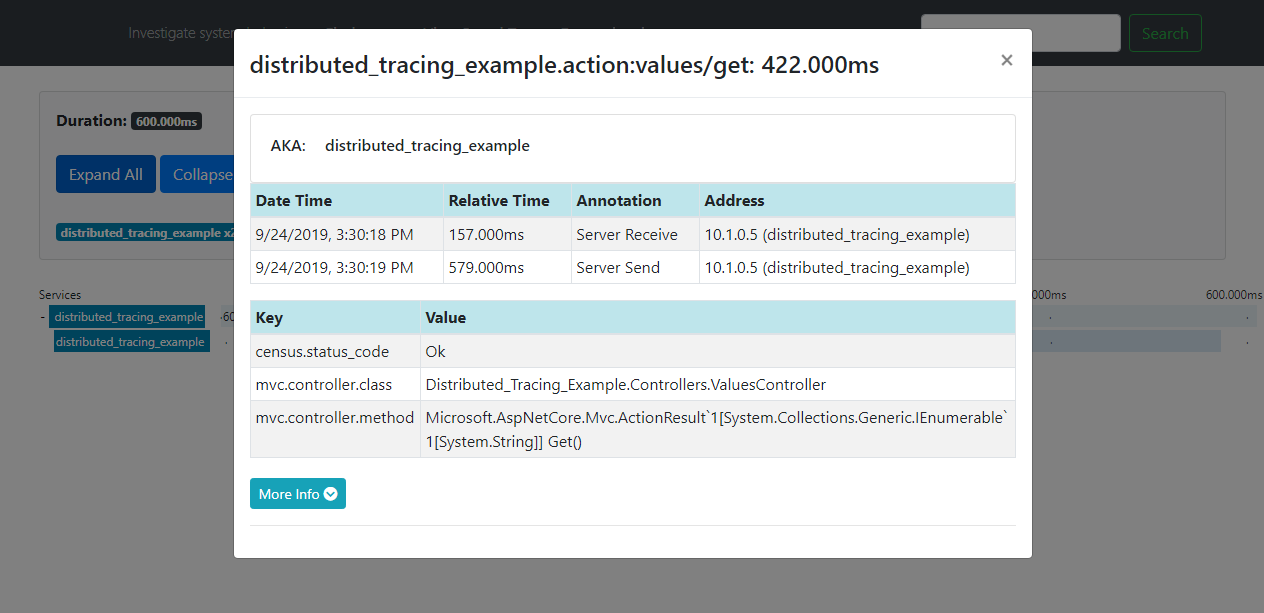
Clicking on that trace will drill into the details. Then clicking on a specific action within the trace will give you even more detail.